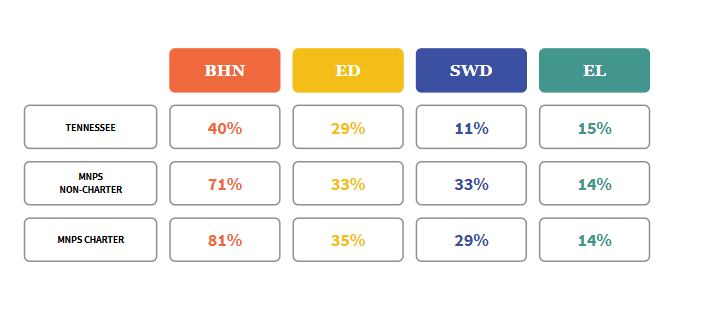
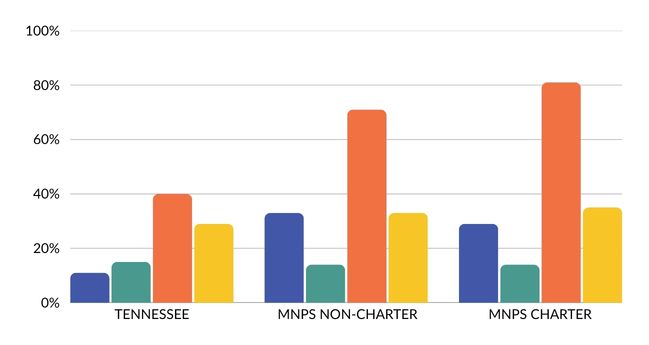
Public charter schools serve a higher percentage of economically disadvantaged students and Hispanic students than Metro Nashville Public Schools overall. Public charter schools in Nashville are proving it’s possible to close the achievement gap.
1 in 5 students in Nashville attends a public charter school.
Black, Hispanic, Native American
0%
Compared to 71% in all MNPS schools and 40% across the state.
Economically Disadvantaged
0%
Compared to 33% in all MNPS schools and 29% across the state.
Students with Disabilities
0%
Compared to 33% in all MNPS schools and 11% across the state.
English Language Learners
0%
Compared to 14% in all MNPS schools and 15% across the state.